
Wazuh is a SIEM (Security Information and Event Management) system that can be used to centralize logs and other security related information from systems on our networks. Using this information, analysts can detect and respond to intrusions, attacks and other malicious activity. For this homelab, Wazuh will be used in conjunction with Suricata to monitor our networks.
Installation
Container Setup
Create a new Ubuntu LXC.
- Storage: 30 GB
- CPU: 2 Cores
- Memory: 4 GB
- Network: vmbr0 – Static IP: 10.80.80.60
- DNS: Host Settings
Update System
Start the machine and update the system:
apt update && apt upgrade -yInstall Dependencies
Run the following commands to install the dependencies for Wazuh:
apt install curl dnsutils net-tools sudo gnupg -yRun Installation Script
Navigate to the tmp folder then download the script.
cd /tmp
curl -sO https://packages.wazuh.com/4.3/wazuh-install.sh
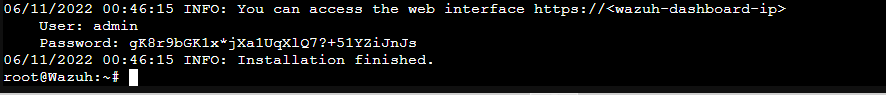
bash ./wazuh-install.sh -aOnce the installation is finished, you’ll receive the password to log in to the dashboard. But, we’re going to change the password before logging in. Alternatively, this password can be stored in a password manager instead of changing it.
Change Admin Password
Download the password change script:
curl -so wazuh-passwords-tool.sh https://packages.wazuh.com/4.3/wazuh-passwords-tool.shThen run the script with:
bash wazuh-passwords-tool.sh -u admin -p <newpassword>The new password must meet complexity requirements so the script will throw an error if they are not met. After the script finishes running, clear the bash history.
history -cThen, reboot the system.
Configuring Wazuh
Initial Setup
Configure Firewall Rules
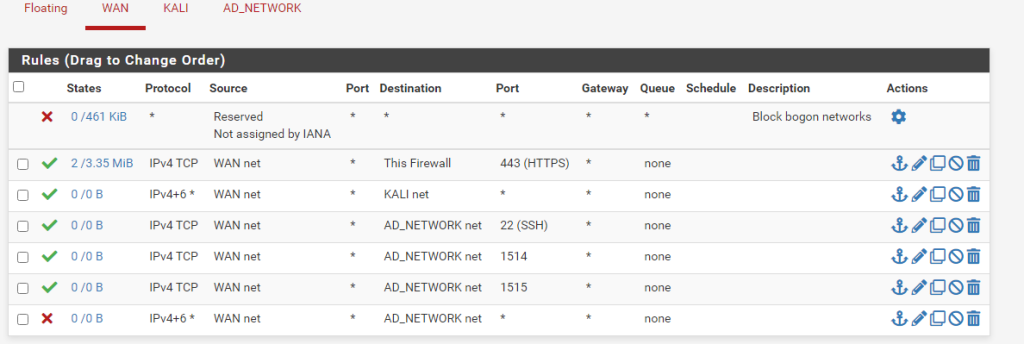
If your firewall rules block traffic between the networks the Wazuh server sits on and the machines it monitors, make sure ports 1514 and 1515 are open.
Logging In
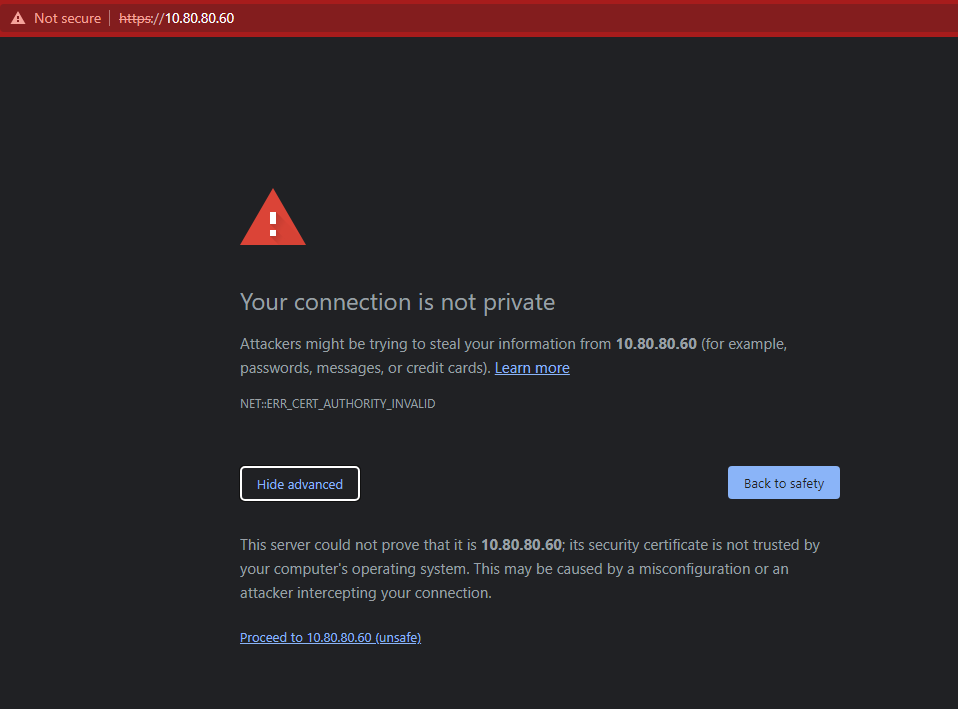
You’ll get a privacy error when first entering. Hit “advanced” then proceed.
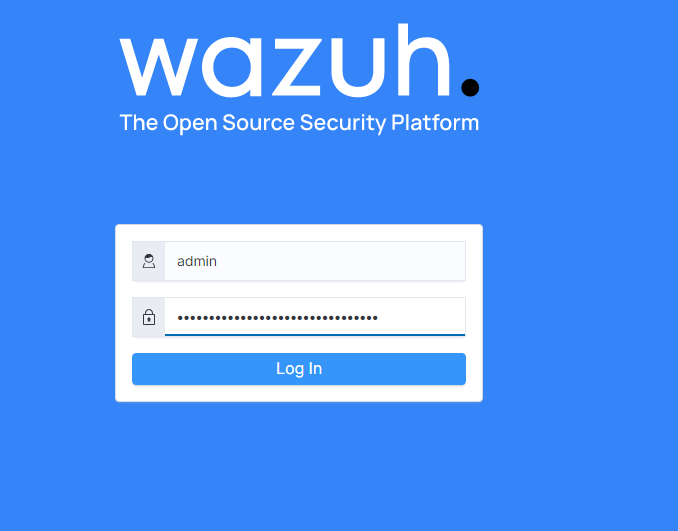
Log in with “admin” and the password made during installation.
Enable Vulnerability Detector
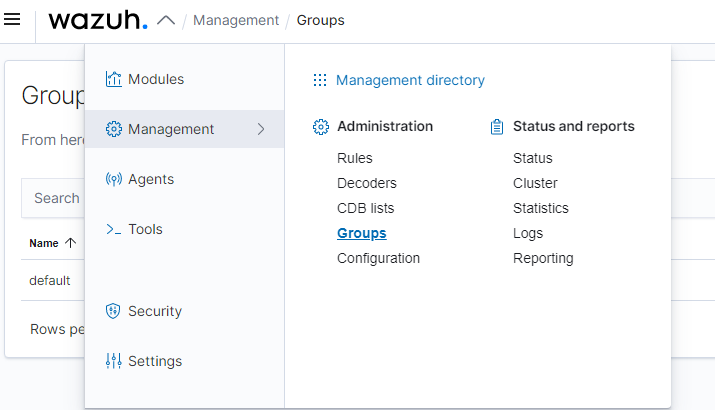
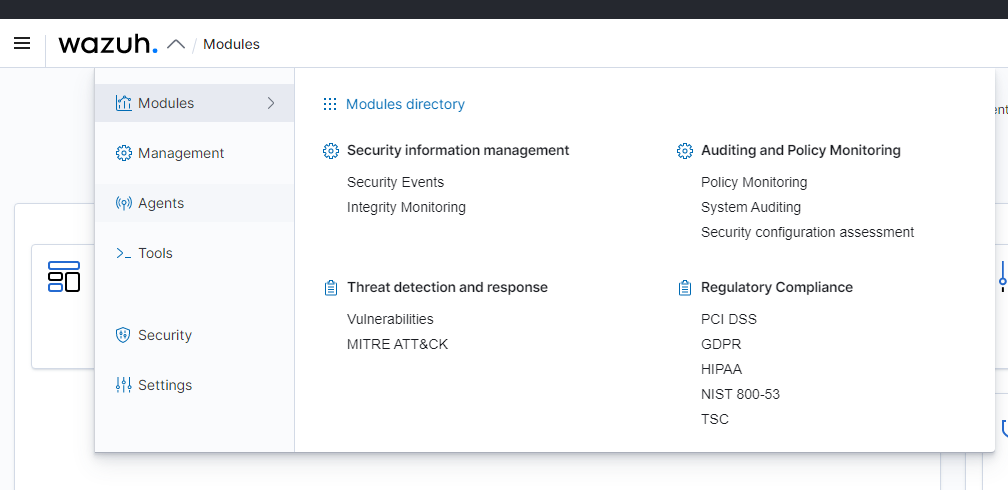
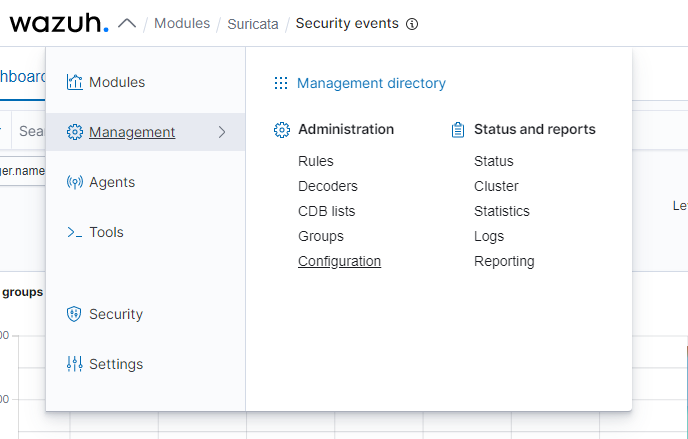
The first thing we’re going to do is set up the vulnerability detector for the machines we’re monitoring. On the home screen, click on the arrow next to “Wazuh” near the top-left corner. Click “Management” then “Configuration.”
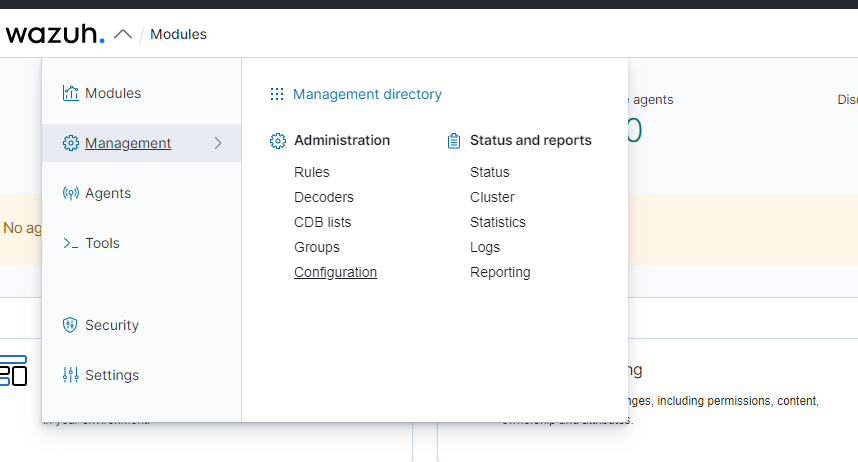
On the next page, click “Edit Configuration” in the top-right corner.

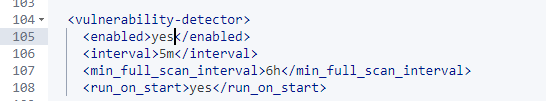
Scroll down until you find the vulnerability detector line. Change it to yes.
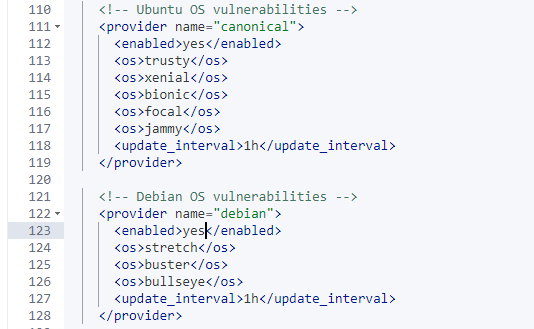
Enable detection for Ubuntu and Debian systems as well since those systems are on our networks.
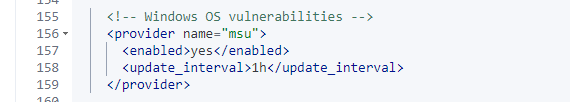
Make sure the Windows OS vulnerabilities are enabled as well.
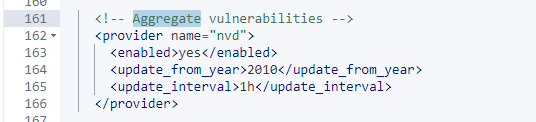
Make sure aggregating vulnerabilities is enabled.
After that is done, click “Restart Manager.”
Create Groups
Click “Add New Group” and save. I’m creating groups for the Active Directory network and the LAN where the Kali machine sits.
Deploy Agents
Windows System Agent
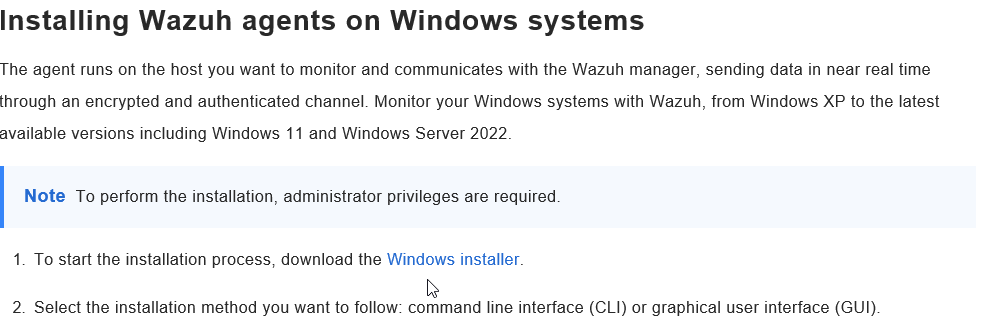
In order to monitor a system, an agent needs to be installed on it. We’ll start with a Windows system. For Windows, we’re going to install the GUI agent.
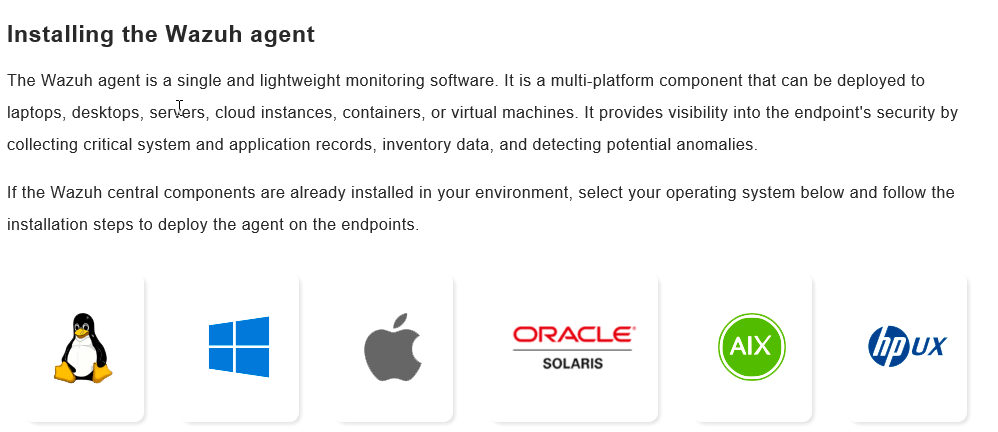
Log on to one of the Windows VMs. Open the web browser and go to https://www.documentation.wazuh.com. Then, click on installation guide. Scroll down to “Installing the Wazuh Agent” then click on the Windows icon.
Download the installer.
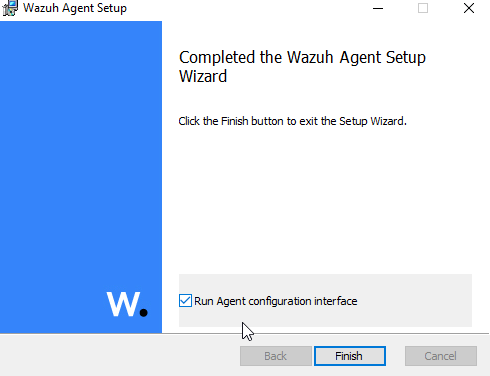
Run the file.

Check the box for “Run Agent Configuration Interface.”
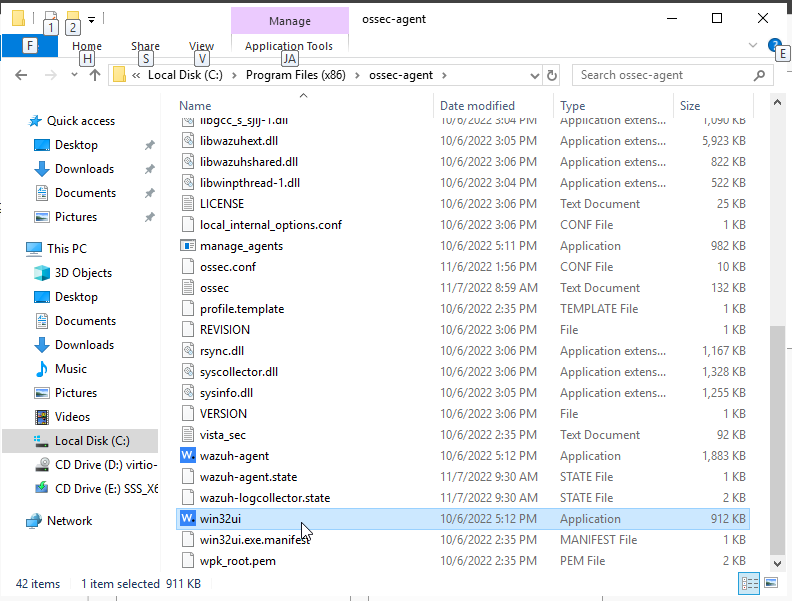
Open the file explorer. Go to C:\Program Files (x86)\ossec-agent and open the win32ui.
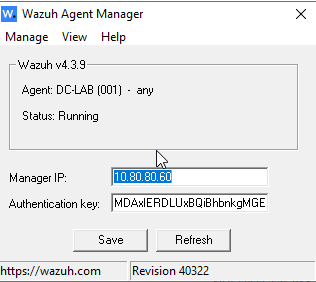
Enter the IP address of the Wazuh server and save. Then click “Manage” and “Start.”
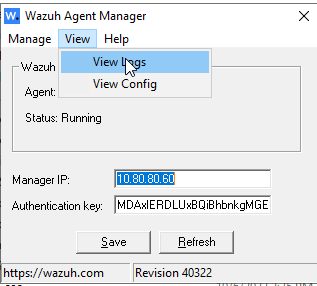
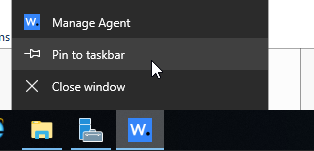
You can view the logs by clicking “View” then “View Logs.” Pin the agent to the taskbar for ease of access later.
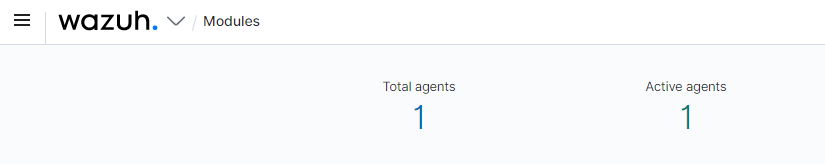
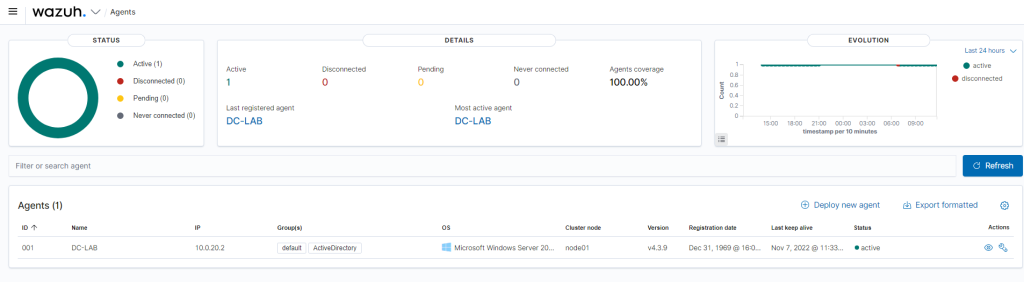
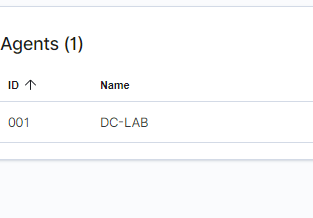
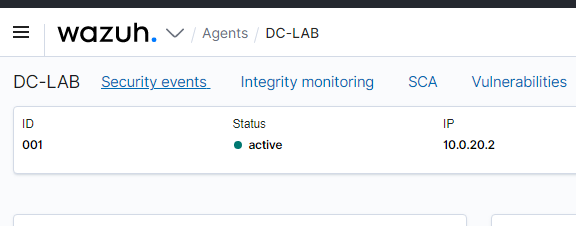
Go back to the Wazuh dashboard. You should see a 1 under total agents and active agents. Open the “Agents” menu and click “Agents.”
We can see our Domain Controller is now connected.
Testing Alerts
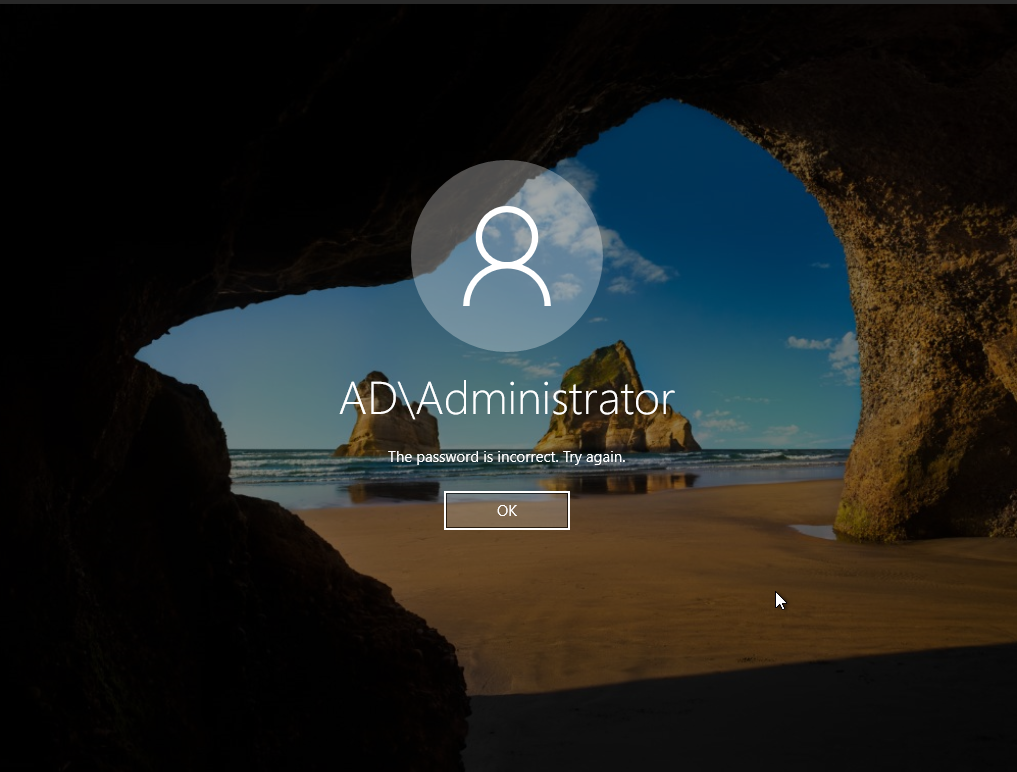
Let’s test a situation where someone is trying to log in to the admin account of the domain controller with random passwords. We want to see if Wazuh picks up the failed log in attempts.
Go back to the windows server. Log out and try to log in with an incorrect password a few times.
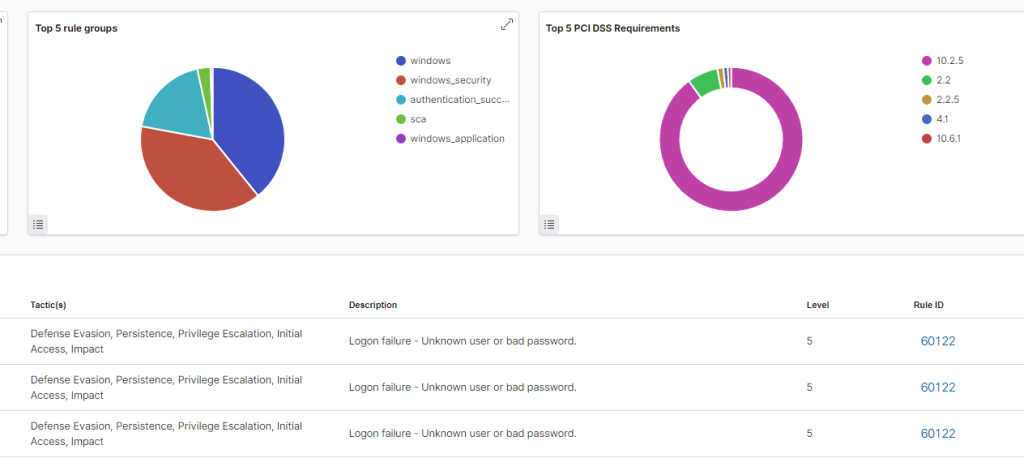
Then, go back to the Wazuh dashboard and click on the name of the Windows machine in the Agents list.
Scroll down and you should see the failed log in attempts. Of course, password policies can be put in place to prevent brute-forcing passwords but this is just for demonstration.
Next, we’ll deploy an agent on a Linux system.
Linux Agent
Go back to the Agents menu. Click on “Deploy New Agent.”
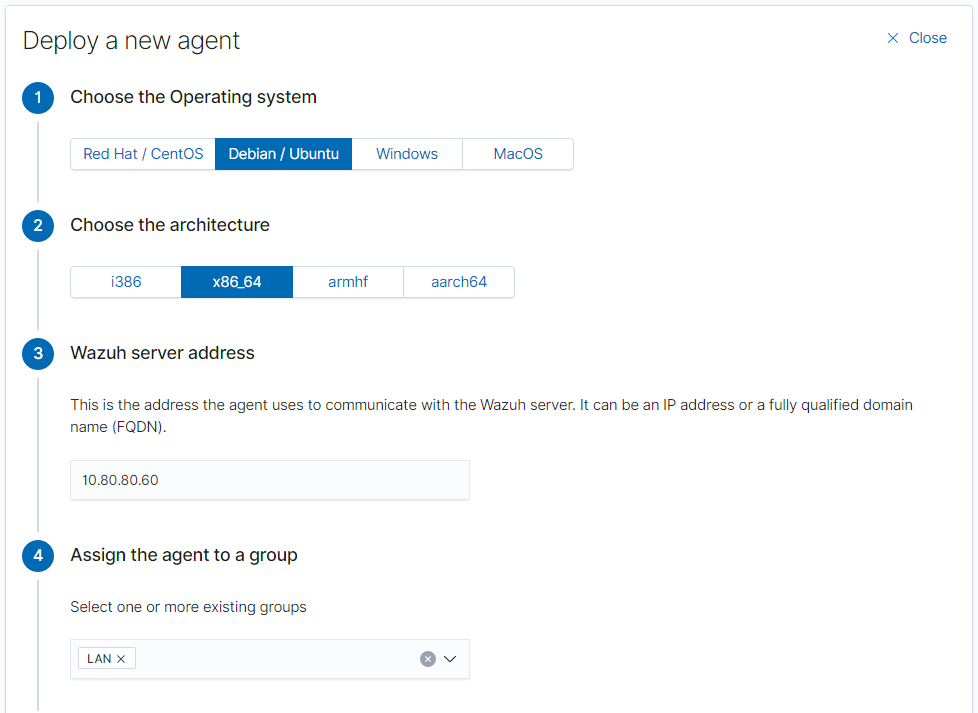
Choose the appropriate operating system. We’re going to deploy the agent to the Suricata server, so it’ll be Debian/Ubuntu. The architecture will be x86_64 (64-bit). The server address will be the Wazuh server address.
Copy the commands and run them in the target machine.


Back in the Wazuh dashboard, refresh the agents list and you should see the machine added to the list.
Threat Detection and Active Response
Detection
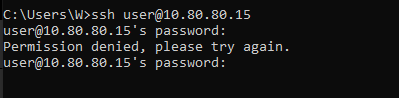
I’m going to attempt to ssh into the Suricata server with an incorrect username and password.
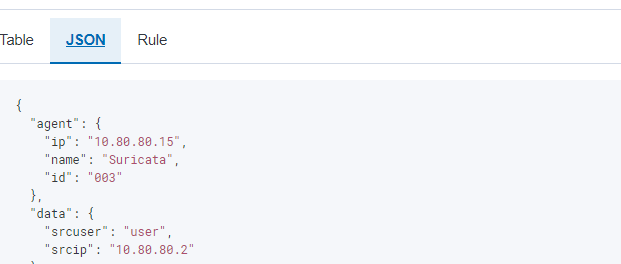
In the Wazuh dashboard, under the security events for the Suricata server, the event is recorded.

Click on the alert to expand the menu. Click on “JSON” to see more information such as the source IP and the username attempted.
Active Response
Next, we’re going to have Wazuh respond to this sort of attack by dropping the packets.
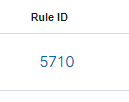
Make note of the rule ID for this alert which is 5710 in this case.
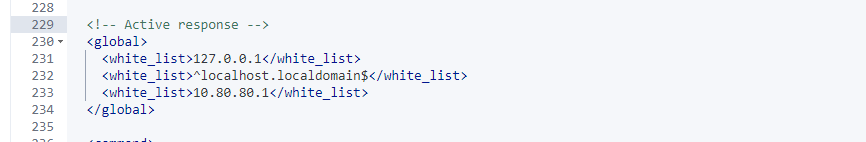
Scroll down to the “Active-Response” section of the XML.
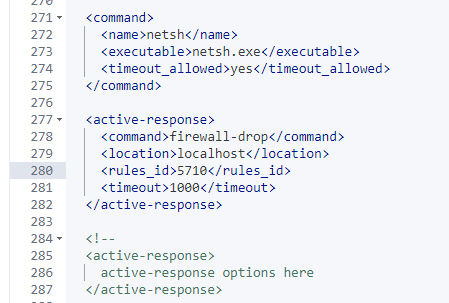
Scroll to the bottom of this section and add the following lines:
  <active-response>
    <command>firewall-drop</command>
    <location>localhost</location>
    <rules_id>5710</rules_id>
    <timeout>1000</timeout>
  </active-response>
When done, the XML should look like this:
Then save the configuration and restart the manager.
Confirming Threat Mitigation
Attempt to ssh into the Suricata server again. After entering the password, the terminal should hang for a while. Then, the connection should time out. This indicates the packets were dropped altogether by Wazuh.

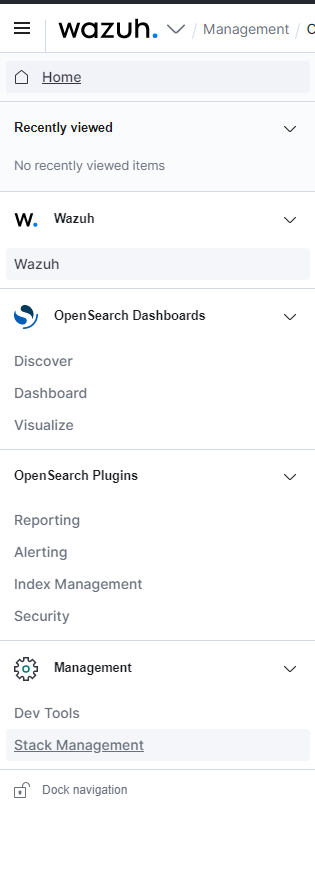
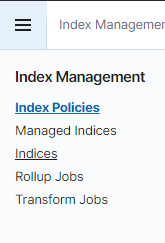
Index Management
The final step for configuring Wazuh is index management. Without an index policy, Wazuh indices will continue to fill up disk space and eventually cause performance issues.
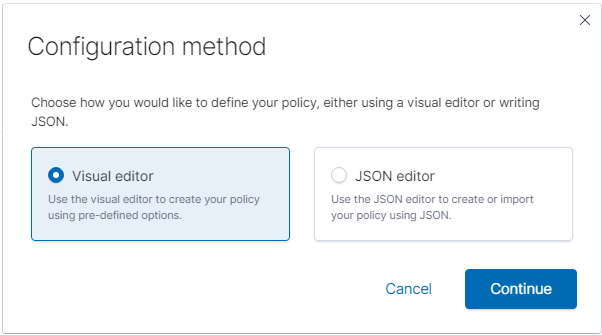
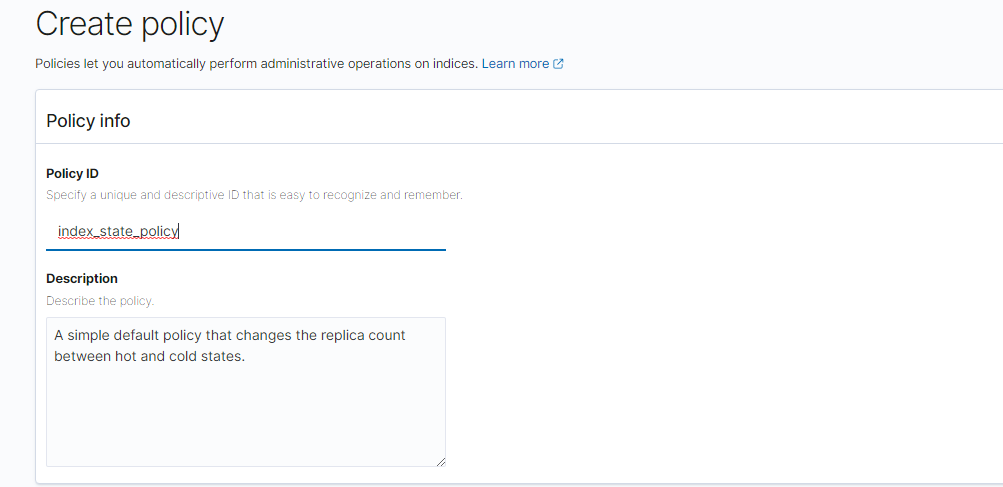
Create New Policy
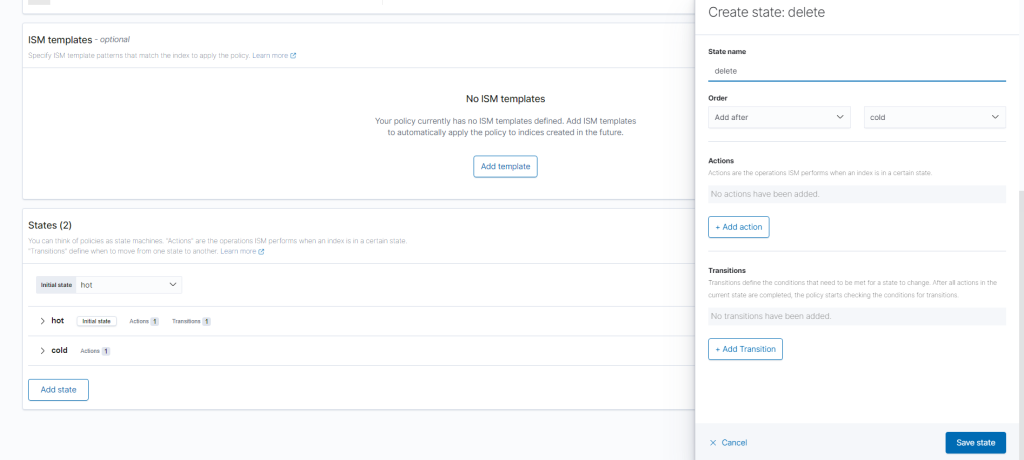
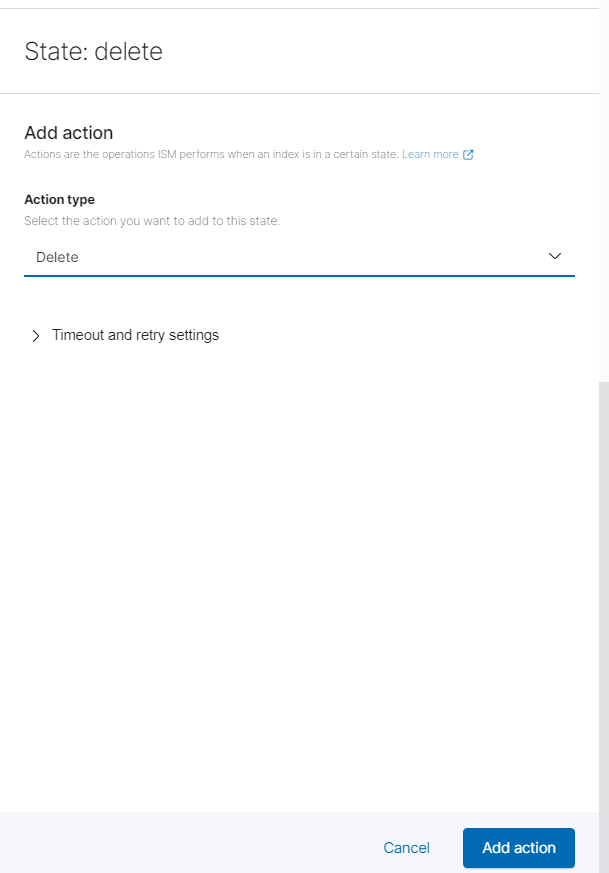
Add Delete State
Scroll to the bottom of the screen and click “Add State.” Click “Add Action” and choose “Delete” from the drop down menu. Then click “Add Action.” Then “Save State.”
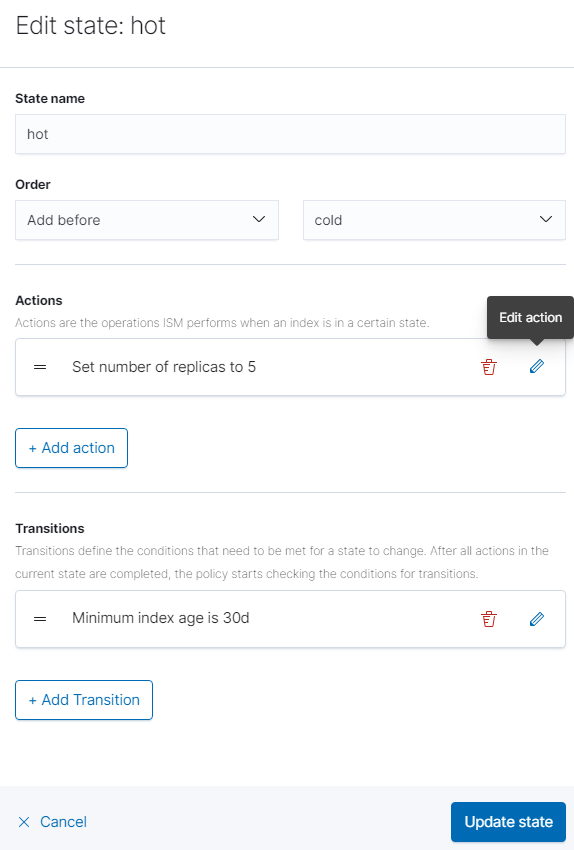
Edit Hot State
Expand the hot state menu, then click “Edit.”
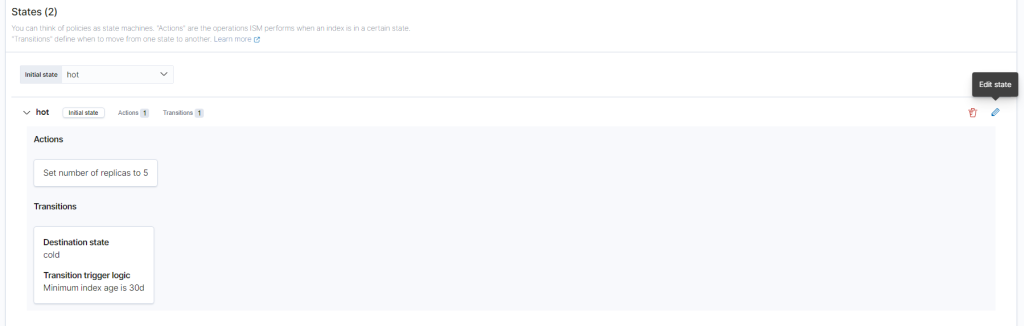
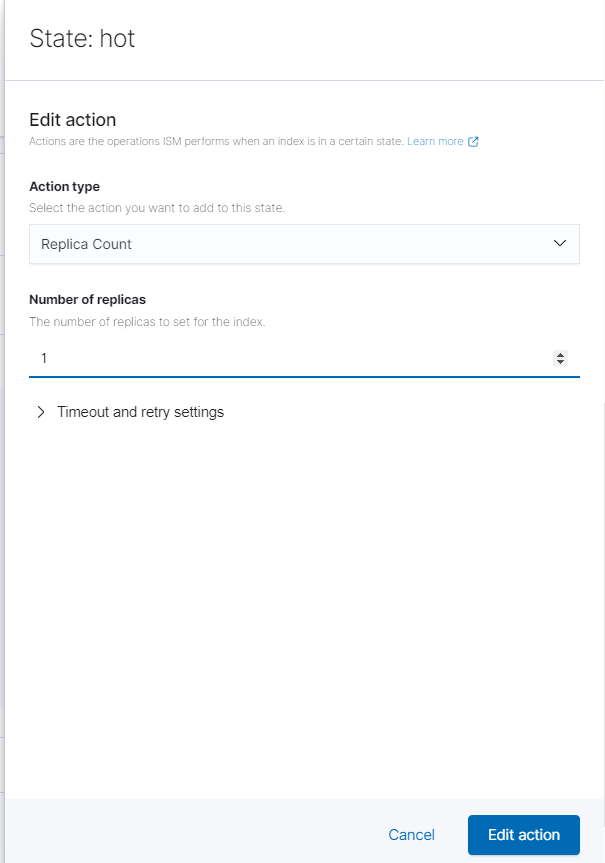
Click the pencil under “Actions” to edit the number of replicas. Change it to 1. Then click “Edit Action.”
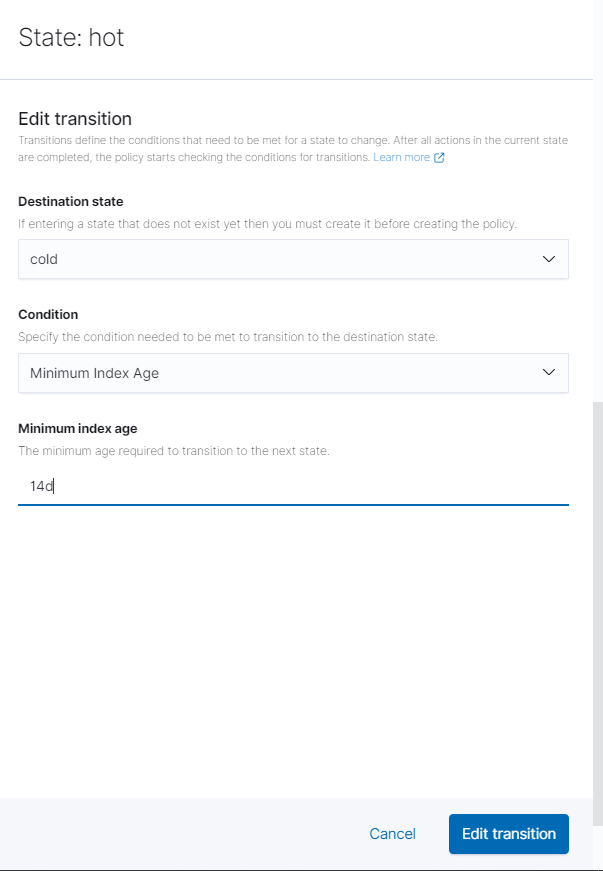
Then under transitions, edit the minimum index age to how long you want to keep the files before they are sent to the cold state. I went with 14 days. Click “Edit Action” then “Update State.”
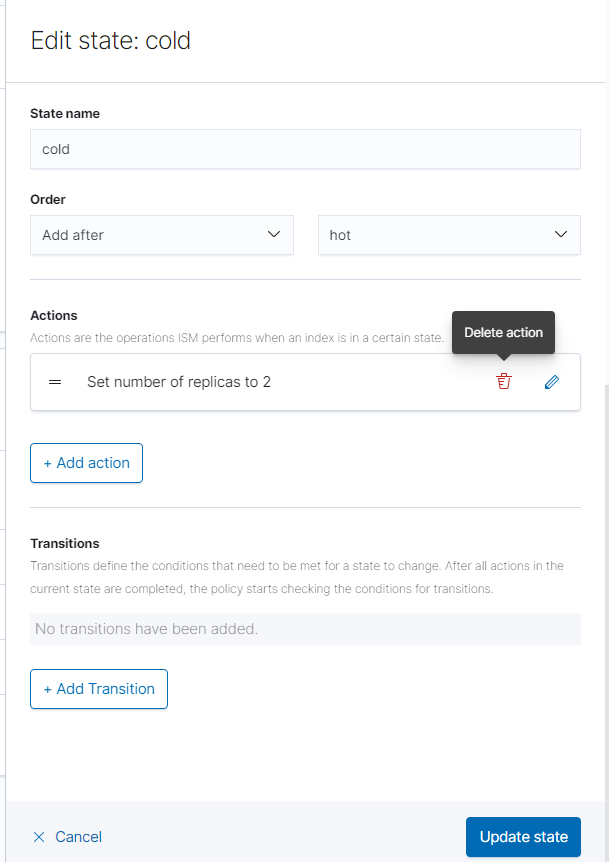
Edit Cold State
Finally, edit the cold state by first deleting the replicas action. Then, add the “Read-Only” action and click “Edit Action.”
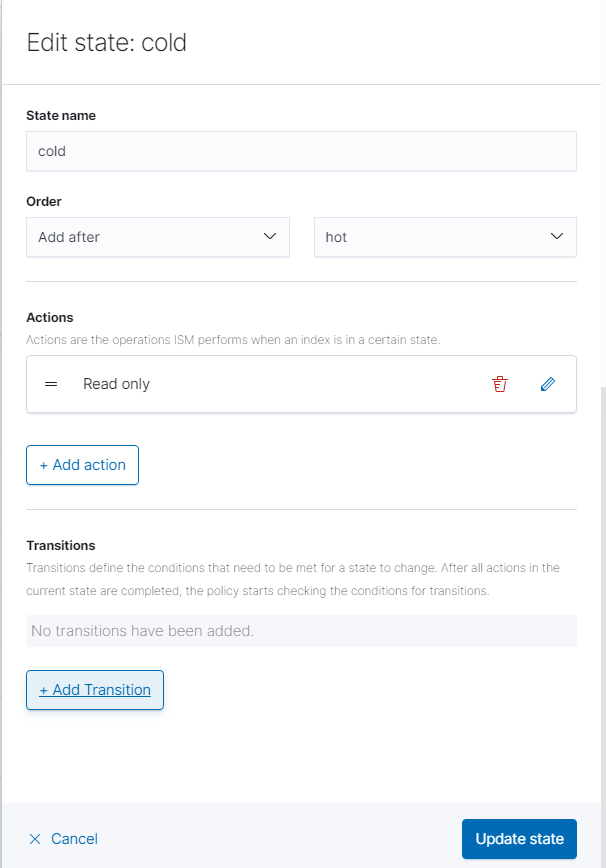
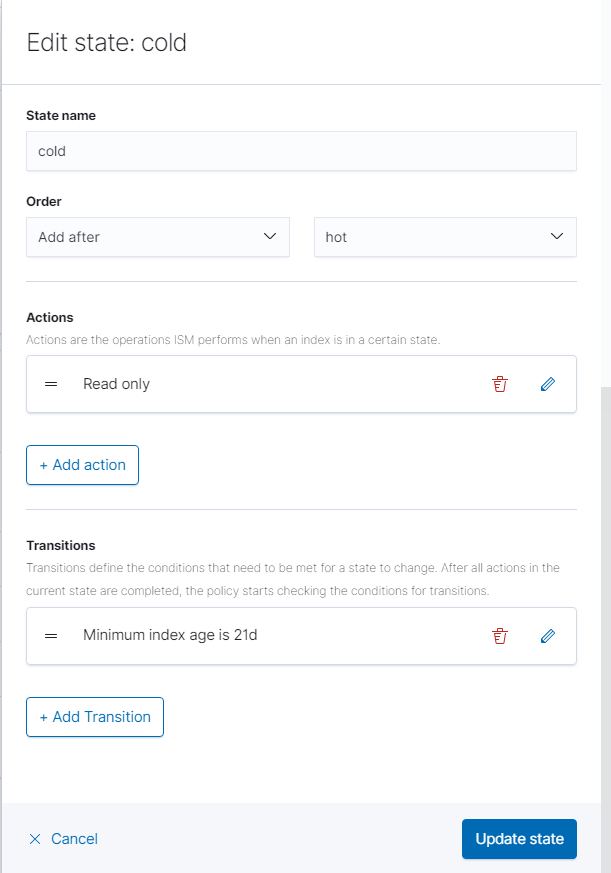
Click “Add Transition” and change the minimum index age to a lower number of days if desired. Click “Update State.” Afterwards, click “Create” in the bottom right-hand corner.
Apply Policy to Indices
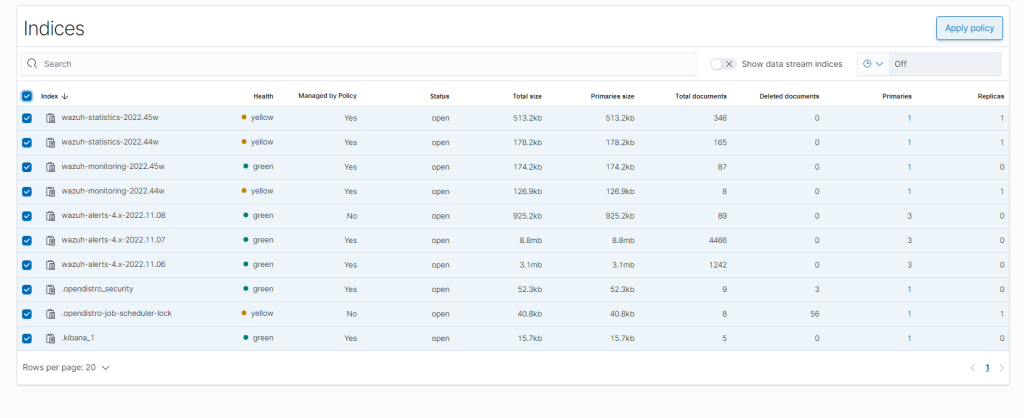
Before the policy can take affect, it first has to be applied to the indices. Go back to the “Index Management” menu and click “Indices.”
Check the boxes of the indices you want the policy management to apply to, then click “Apply Policy.”
That it for this setup. You now have a SIEM to monitor your network. In a future post, we’ll set up the Suricata server to forward its logs to Wazuh so those alerts can be viewed in Wazuh as well.