- Creating a pfSense Firewall
- Installing Kali Linux in Proxmox
- Configuring pfSense Firewall
- Configuring Suricata IDS in Proxmox
- Adding an Active Directory Forest to Proxmox
- Wazuh SIEM Setup in Proxmox
In this post, we’re going to set up an IDS (Intrusion Detection System) called Suricata for our lab. What’s an IDS? It’s a program that analyzes network traffic to look for malicious or suspicious data based on pre-configured rules. Similar to how anti-virus software can identify malware based on signatures, an IDS can analyze network traffic for specific signatures and log these alerts. The difference with an IDS like Suricata is that it can be configured to alert us to anything we want it to including machines connecting to specific IP addresses, ports, or connecting to servers outside of certain hours. Our choice of IDS will be Suricata.
Initial Setup
LXC Creation
Start by creating a new Ubuntu 22.04 LXC. Refer to the Bookstack article for downloading container templates. Don’t start the machine after creation.
Specs:
- 25 GB of storage
- 2 cores
- 2 GB RAM
- Network: vmbr0; Set a static IP
- DNS: Host settings
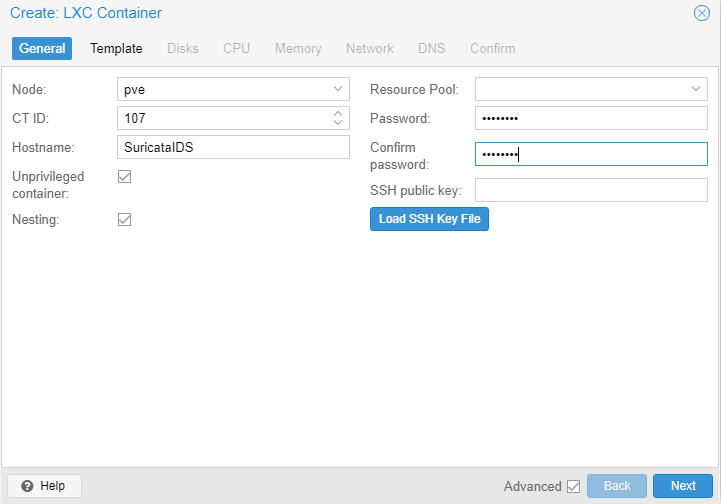
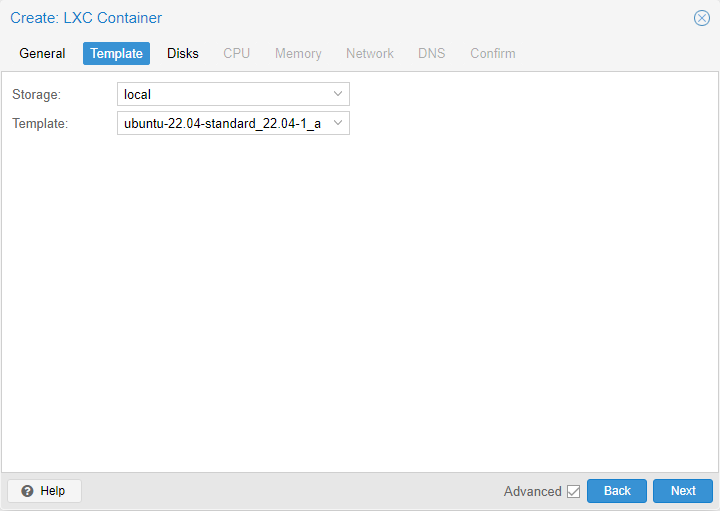
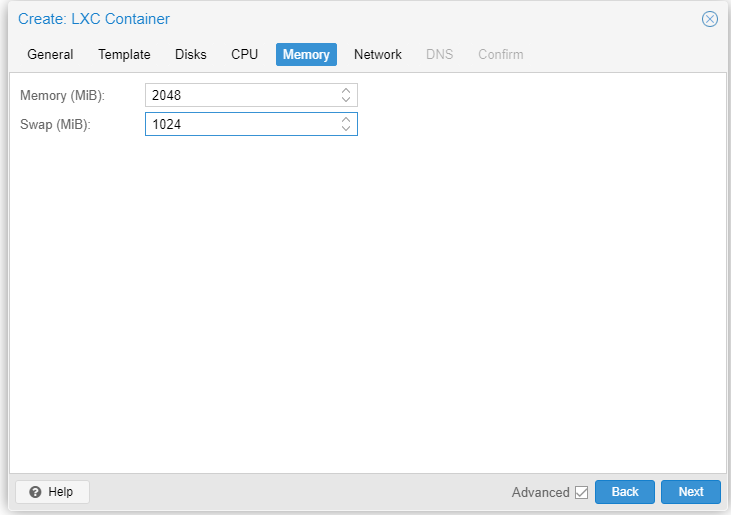
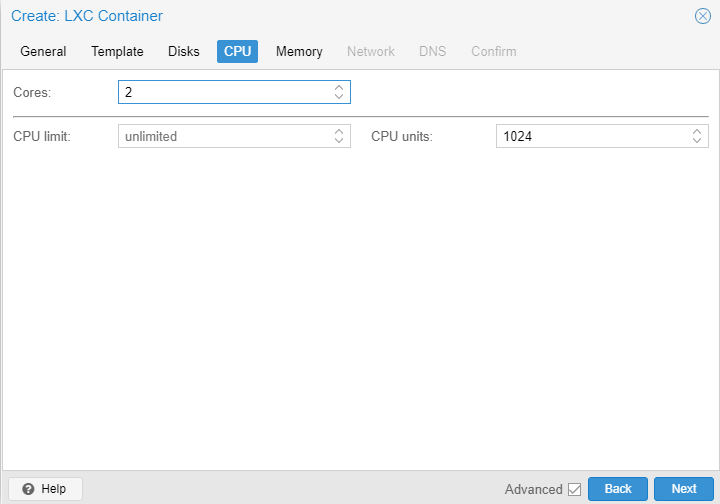

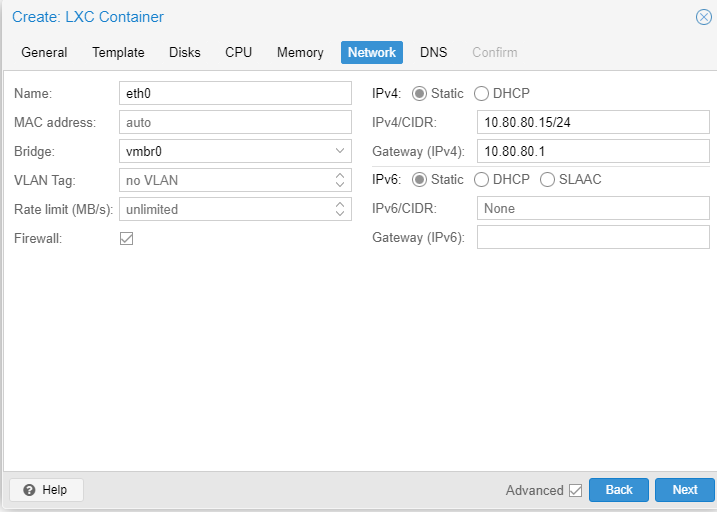
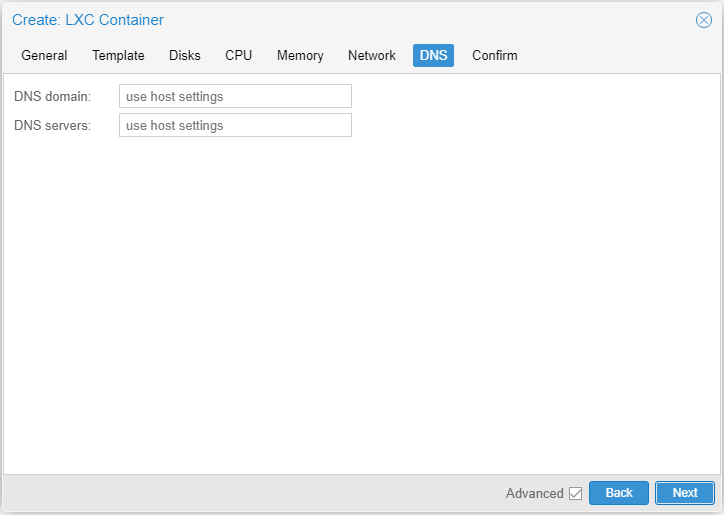
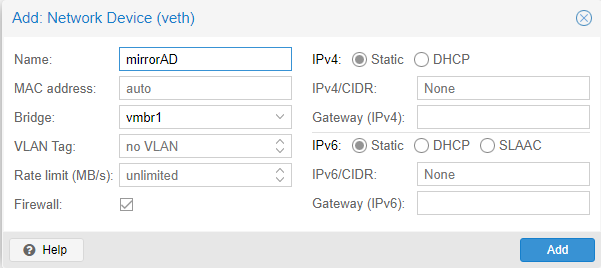
Afterwards, add another network interface for vmbr1, the internal/lab switch. The interface is going to send copies of packets of machines connected to the internal switch to this server. No IP will be assigned to this interface. Make sure the firewall is unchecked. After adding the device, start the machine.
Host System Configuration
Log in and update the system.
apt update && apt upgrade -yOptional: install vim
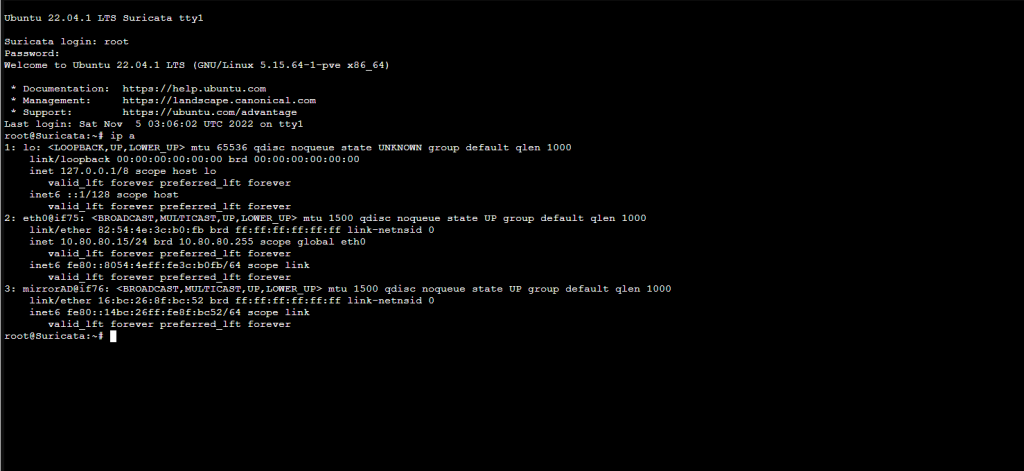
apt install vimCheck our interface:
ip aInterfaces look correct. We can continue.
Suricata Install
Create SPAN Port on Lab Switch
In this setup, we want a copy of all traffic on the pfSense internal switch to be sent to the Suricata server. To do that, we need create a SPAN port on that switch.
Open the shell on your Proxmox server, and run the command:
ip link show | grep container-idwhere container-id is the id number of the Proxmode node for the suricata server.
In my case, the id is 107. If you are seeing extra interfaces that start with “fw,” make sure the firewalls are off on the network interfaces for the suricata server.


The first interface veth103i0@if2 is the interface connected to the home network where the machine receives it’s IP. The second interface for the SPAN port.
Now, run the following command in the Proxmox shell to create a span port on the lab switch:
ovs-vsctl -- --id=@p get port (Interface_Name) -- --id=@m create mirror name=suriIDS select-all=true output-port=@p -- set bridge vmbr1 mirrors=@mwhere “Interface_Name” is where the interface of the span port will be. For my system the command will be:
ovs-vsctl -- --id=@p get port veth103i1 -- --id=@m create mirror name=suriIDS select-all=true output-port=@p -- set bridge vmbr1 mirrors=@mConfigure Suricata
Installation
Back in the Suricata machine, run the following commands:
apt install suricata jqThis will install Suricata and the jq package which is a useful command line tool for reading and manipulating json data.
Edit Suricata.yaml
Next, we need to setup the interface Suricata is going to monitor. Open up the suricata.yaml fille:
vim /etc/suricata/suricata.yamlThe first line to change is the home network. We’re going to change this to the networks we’re going to monitor. In our case , this is the LAN on 10.0.10.0/29 and the Active Directory network on 10.0.20.0/28.


Make sure the eve.json file is enabled.

Change the interface from eth0 to the monitoring interface.


Change the default rule path and add a local rules file.


Create Custom Rules
Create a file for custom rules by running command:
vim /etc/suricata/rules/local.rulesWe’re going to create a generic test rule to test our system. Add the following lines to the file:
alert icmp any any -> any any (msg: "ICMP Packet Found";)Finally, restart Suricata to apply the changes. Then start Suricata on the monitoring interface in the background.
systemctl restart suricata
suricata -i mirrorAD &
Testing Custom Rules
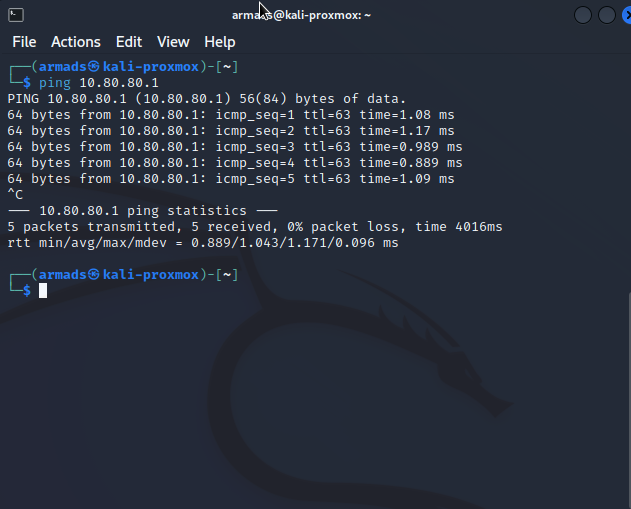
To test the custom rules, we’re going to test the machines connected on the internal switch. Let start with the Kali machine on the 10.0.10.0/29 network. I’m going to ping the default gateway on the home network.
Back on the Suricata server, run the command:
tail /var/log/suricata/fast.logAnd we can see Suricata has picked up the ICMP packets from the Kali machine at 10.0.10.2 to the machine at 10.80.80.1.

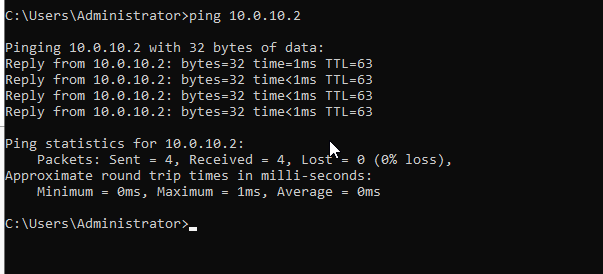
Now, we’re going to test a machine from the Active Directory network. We’ll send a ping from that network to the Kali machine.
Checking the fast.log on the Suricata machine:

The packets from the machine on the Active Directory at 10.0.20.2 were captured as well.
One final test is for the firewall rules. Our firewall is set up so that traffic cannot pass between the Active Directory network and the WAN/home network. Lets confirm it.
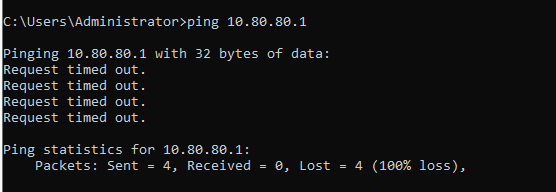
The ping request fails. Let check the Suricata server to see if it picked it up.

We see that Suricata did pick it up and it confirms the machine on the 10.80.80.0 network didn’t reply back. We’ve now confirmed both that our Suricata server and firewall are working as intended.
Now that our IDS is in place, we can start monitoring our machines and set up alerts for unusual activity. This won’t be done with only Suricata though. In the next part of this lab, we’re going to setup a SIEM to centralize logs from all of the machines we’re monitoring. We’ll then forward all of the alerts from Suricata to our SIEM so we can monitor everything going on in our lab environment through one interface.


Each paragraph flows like a river, guiding the reader through a landscape of ideas with ease and clarity.